5 Transaction Monitoring
This section introduces the transaction monitoring screens and explains how to use common functions to customise your display, export information, create custom filters, and display the filters applied to the screen.
5.1 Using the Transaction Functions
All transaction monitoring screens have common functions at the top of the display and page navigation functions at the bottom of the display.
5.1.1 Common Functions
The following common functions are in the top right of the display:
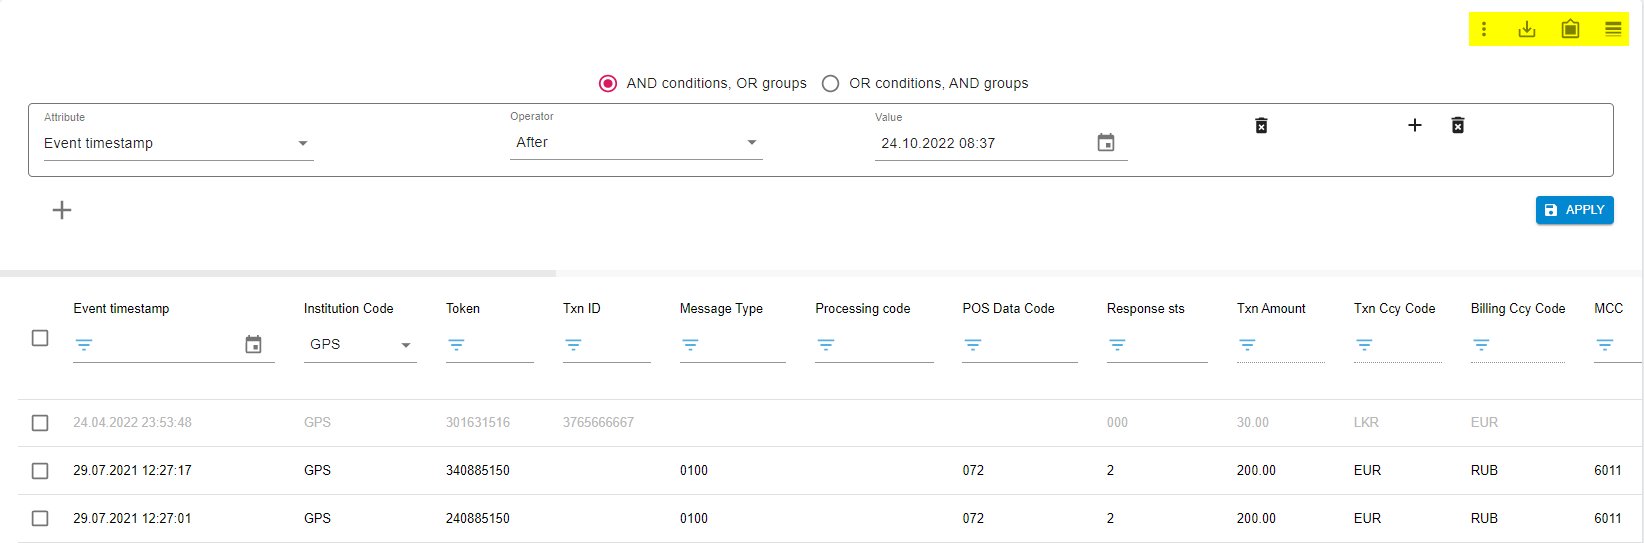
Figure 7: Common functions across the transaction screens. See the following table:
|
Icon |
Command |
Description |
|---|---|---|
|
|
Column customization |
Choose which columns/attributes are displayed on-screen. You can tick or untick the necessary columns/attributes and reorder their appearance by dragging and dropping the columns/attributes into the order you prefer. |
|
|
Export |
Enable the export of all displayed on-screen transactions to either a CSV or an XLSX file. |
|
|
Custom filter |
Save and load frequently used search/data filtering options. Once a certain combination of frequently used filters is present on-screen, you can save this using a meaningful name. After, you can click the same icon to load the saved combination of frequently used filters. |
|
|
Filter builder |
Display the filters applied to the screen. Using this icon, you can add or remove filters. The default filter for the Event timestamp attribute is mandatory and cannot be removed. |
5.1.2 Page Navigation Functions
All transaction monitoring screens allow you to set the number of rows per page displayed on-screen:
![]()
Figure 8: Page navigation functions across the transaction screens. See the following table:
You can navigate through the pages either by clicking on the displayed page numbers, or using the page navigation buttons:
|
Icon |
Command |
Description |
|---|---|---|
|
|
Next page |
Use to load the next page. |
|
|
Previous page |
Use to load the previous page. |
|
|
Last page |
Use to load the last (final) page. |
|
|
First page |
Use to load the first page. |
5.1.3 Sorting data
You can sort information in the columns (for example, under Token) by hovering on a column header and using the up and down arrows to sort in ascending or descending order.
5.2 About the Context-sensitive Menu
When one or more transactions are selected (by selecting the inline tick box  ), a context-sensitive menu with icons appears in the top-right corner of the page. The same options appear in a sub-menu when you right-click on a transaction:
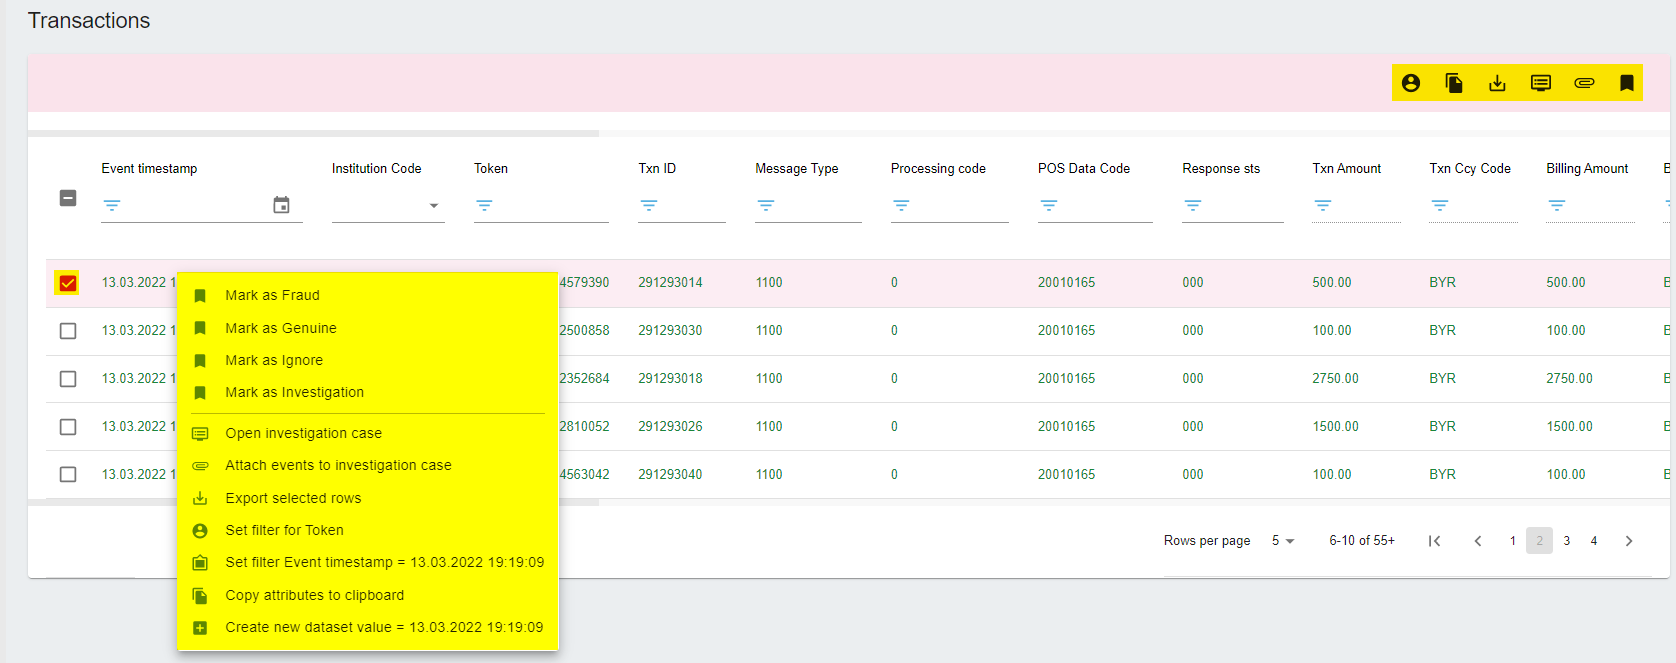
Figure 9: Context-sensitive menu functions in the transaction screens. See the following table:
These functions are explained below:
|
Icon |
Command |
Description |
|---|---|---|
|
|
Mark as Fraud |
Assign a Fraud status to a transaction. |
|
|
Mark as Genuine |
Assign a Genuine status to a transaction. |
|
|
Mark as Ignore |
Assign an Ignore status to a transaction. |
|
|
Mark as Investigation |
Assign an Investigation status to a transaction. |
|
|
Open investigation case |
Open a case for the selected event. |
|
|
Attach events to investigation case |
Attach the selected event to an existing case. |
|
|
Export selected rows |
Export the selected event(s) to a CSV/XLSX format report. |
|
|
Set filter for Token |
Set a filter for the selected/related Token number. |
|
|
Set filter Event timestamp |
Set a filter for the selected/related timestamp. |
|
|
Copy attributes to the clipboard |
Copy the selected transaction’s attributes/values pairs to the clipboard. |
|
|
Create new dataset value |
Add the selected value to an existing dataset. |
5.3 Filtering the Data
To retrieve transactional data for your institution, click on Filter builder, select the date from the default filter and click Apply to retrieve the filtered data.
In the following examples, transactions are filtered using:
-
Event timestamp after 01.07.2021
-
Merchants for which the Acceptor Country is Ukraine ‘UA’
-
Acquirer country is Ukraine ‘UA’
-
Billing amount (in the base currency of the card) is 300
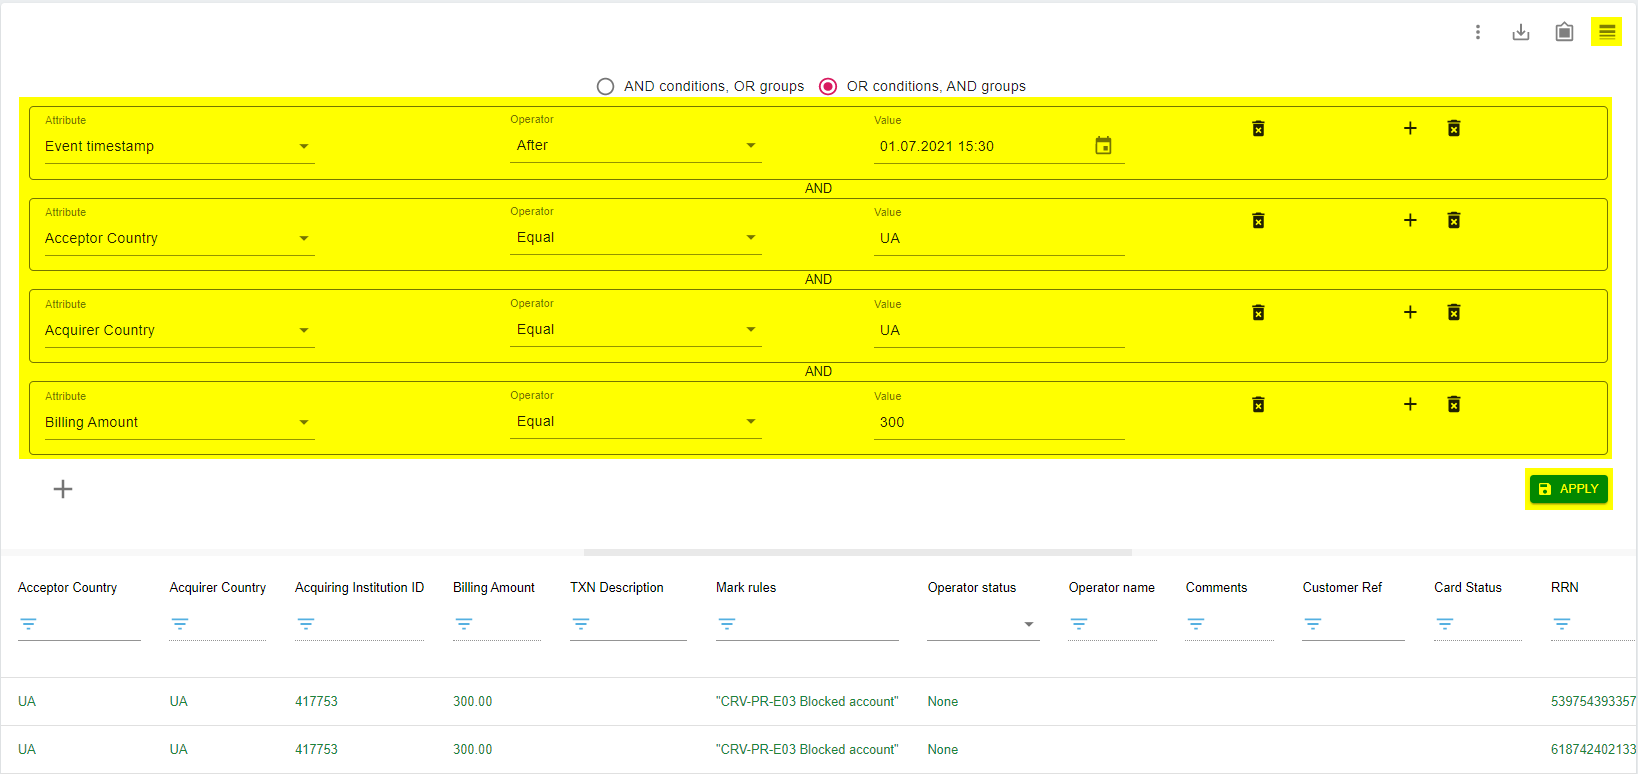
Figure 10: Filtering data in the transaction screens
Further ‘on-the-fly’ data filtering is possible for some columns/attributes, by inputting a filtering value to the right of the ![]() Filter list icon (for columns/attributes that display a continuous straight line under the column/attribute header. Note that ‘on-the-fly’ filtering for columns/attributes that display a dotted line is not available):
Filter list icon (for columns/attributes that display a continuous straight line under the column/attribute header. Note that ‘on-the-fly’ filtering for columns/attributes that display a dotted line is not available):
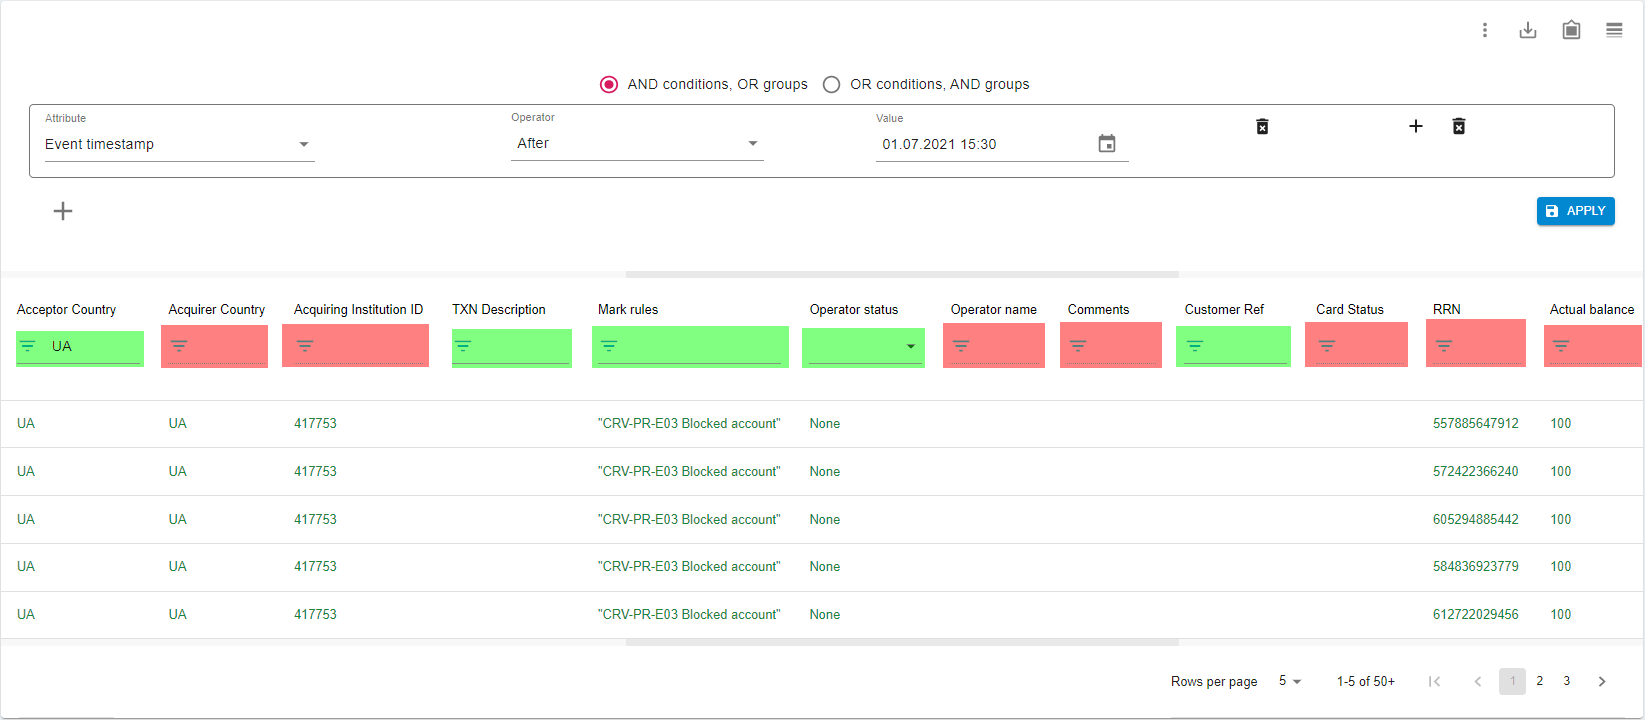
Figure 11: On-the-fly filtering in the transaction screens
5.4 Checking Transaction Details
To check the information available on the system for a particular transaction, click on the transaction to display the details.
The ATTRIBUTES tab shows all the transaction-related details that were sent to Thredd by the Merchant/Acquirer via the Schemes such as Transaction Amount or Acceptor Country, as well as some Thredd proprietary details like the Thredd Product ID of the card on which the transaction was performed.
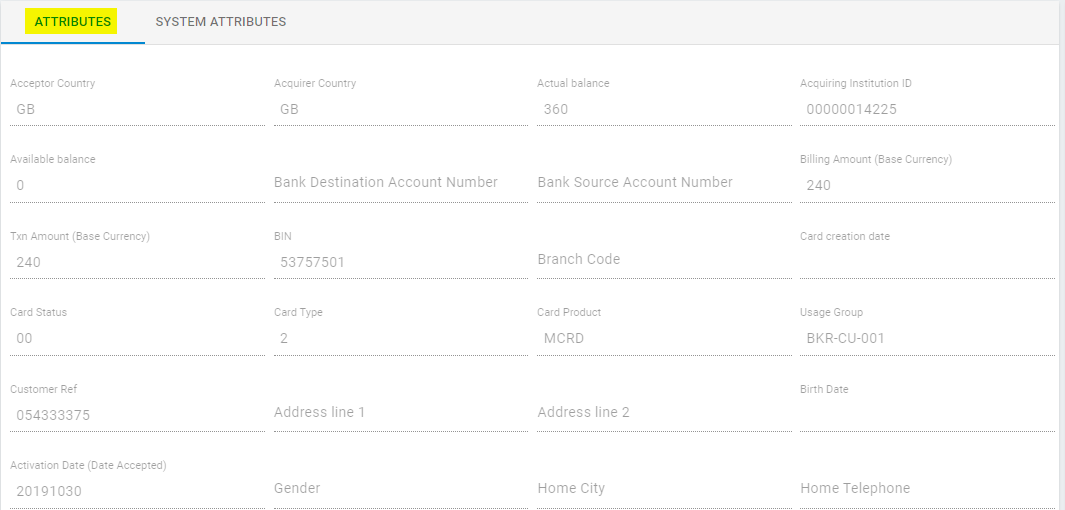
Figure 12: Transaction details
The SYSTEM ATTRIBUTES tab shows Thredd Protect proprietary details such as the Action (if any) that was performed by the system on this particular transaction, the Institution ID, the Processing Time the system needed to process the transaction, etc.
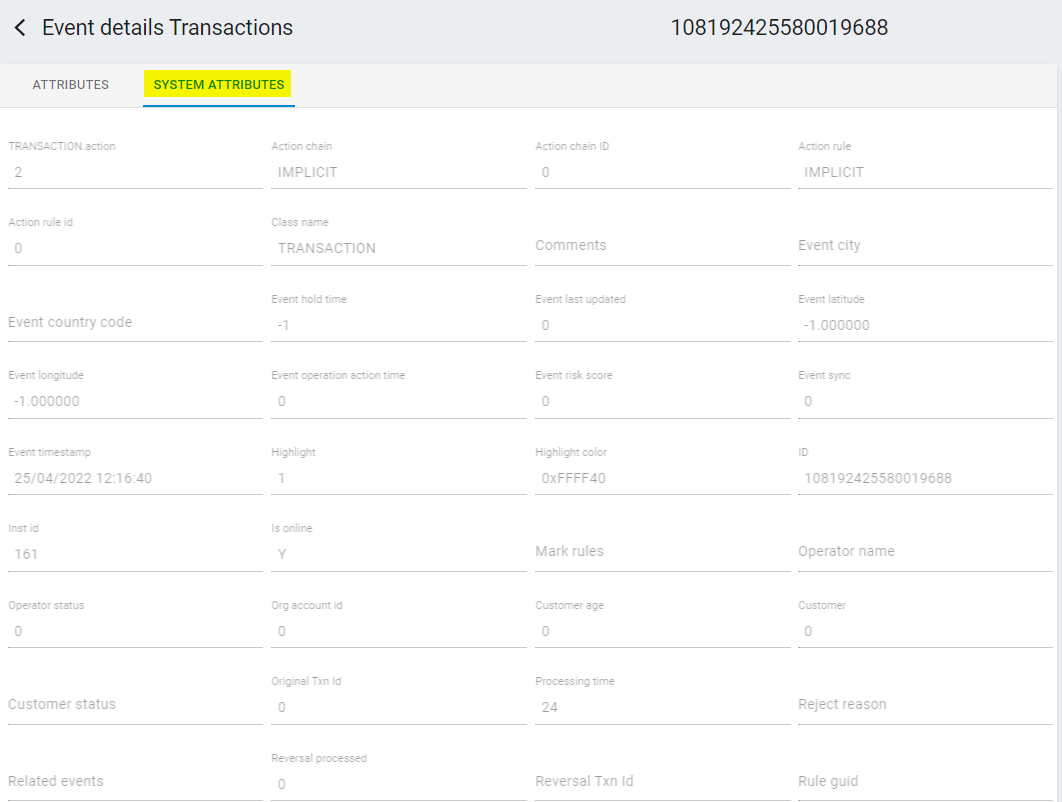
Figure 13: System Attributes details
5.5 Understanding the Monitoring Screens
This topic describes the information shown in the Monitoring Transactions screens and explains how to drill down deeper into the transaction details.
You can sort information in the columns (for example, under Token) by hovering on a column header and using the up and down arrows to sort in ascending or descending order.
5.5.1 Viewing all events/transactions
The Events > Transactions screen displays in near real-time all the transactions performed on your institution’s tokens (this includes all events/transactions, not just the ones marked automatically by the rules, or manually by users).
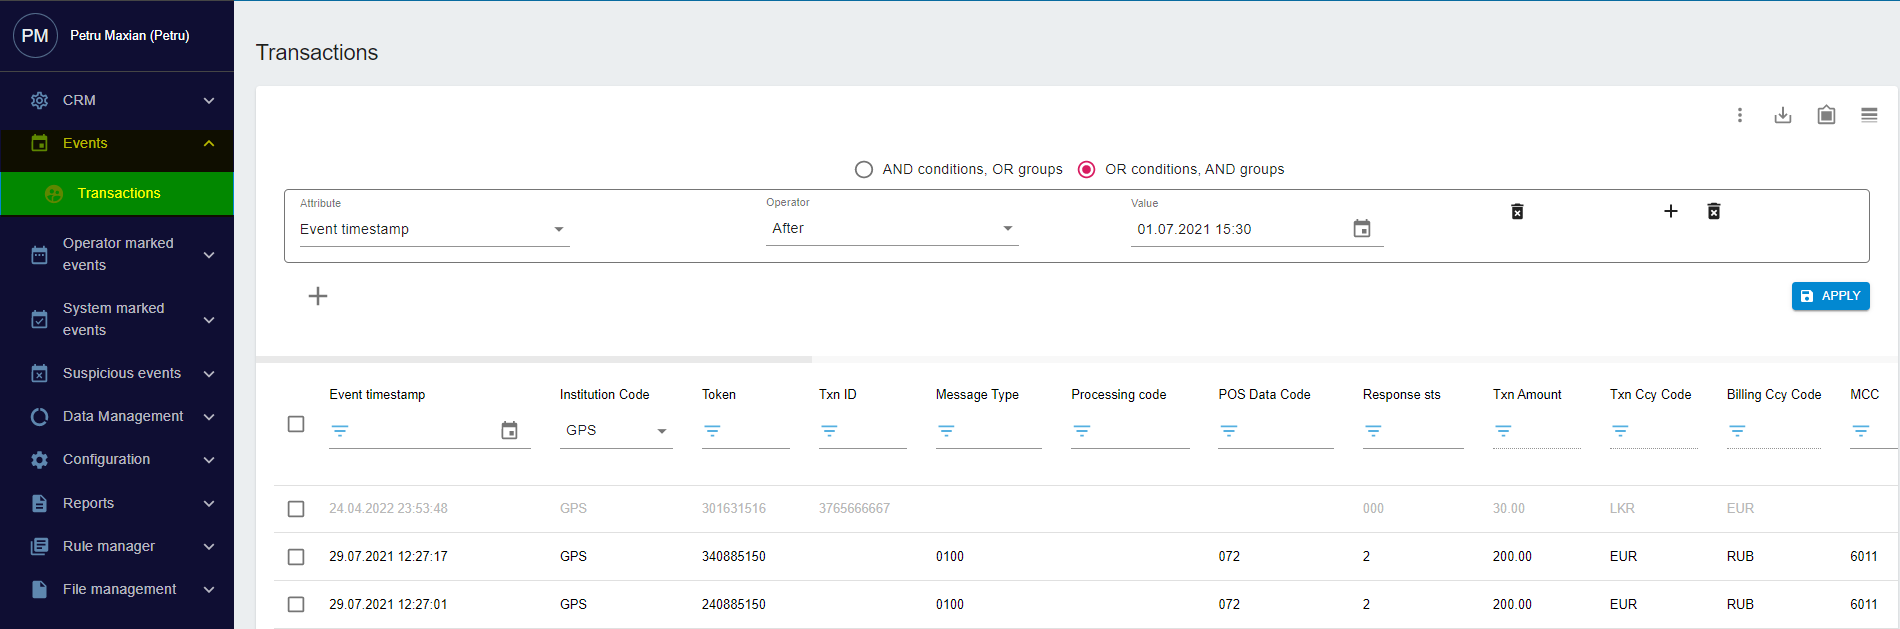
Figure 14: Transactions screen
5.5.2 Viewing system marked events/transactions
The System marked events > System marked Transactions screen displays all the transactions marked automatically by the system. For example, if an active rule is triggered that has Action: Highlight enabled, the highlighted event/transaction appears on this screen because the system has marked the transaction automatically.
![]()
Figure 15: System marked events/System marked Transactions screen
5.5.3 Viewing suspicious events/transactions
The Suspicious events > Suspicious Transactions screen displays all the transactions that triggered an existing active rule that has Action: Marked as suspicious enabled.
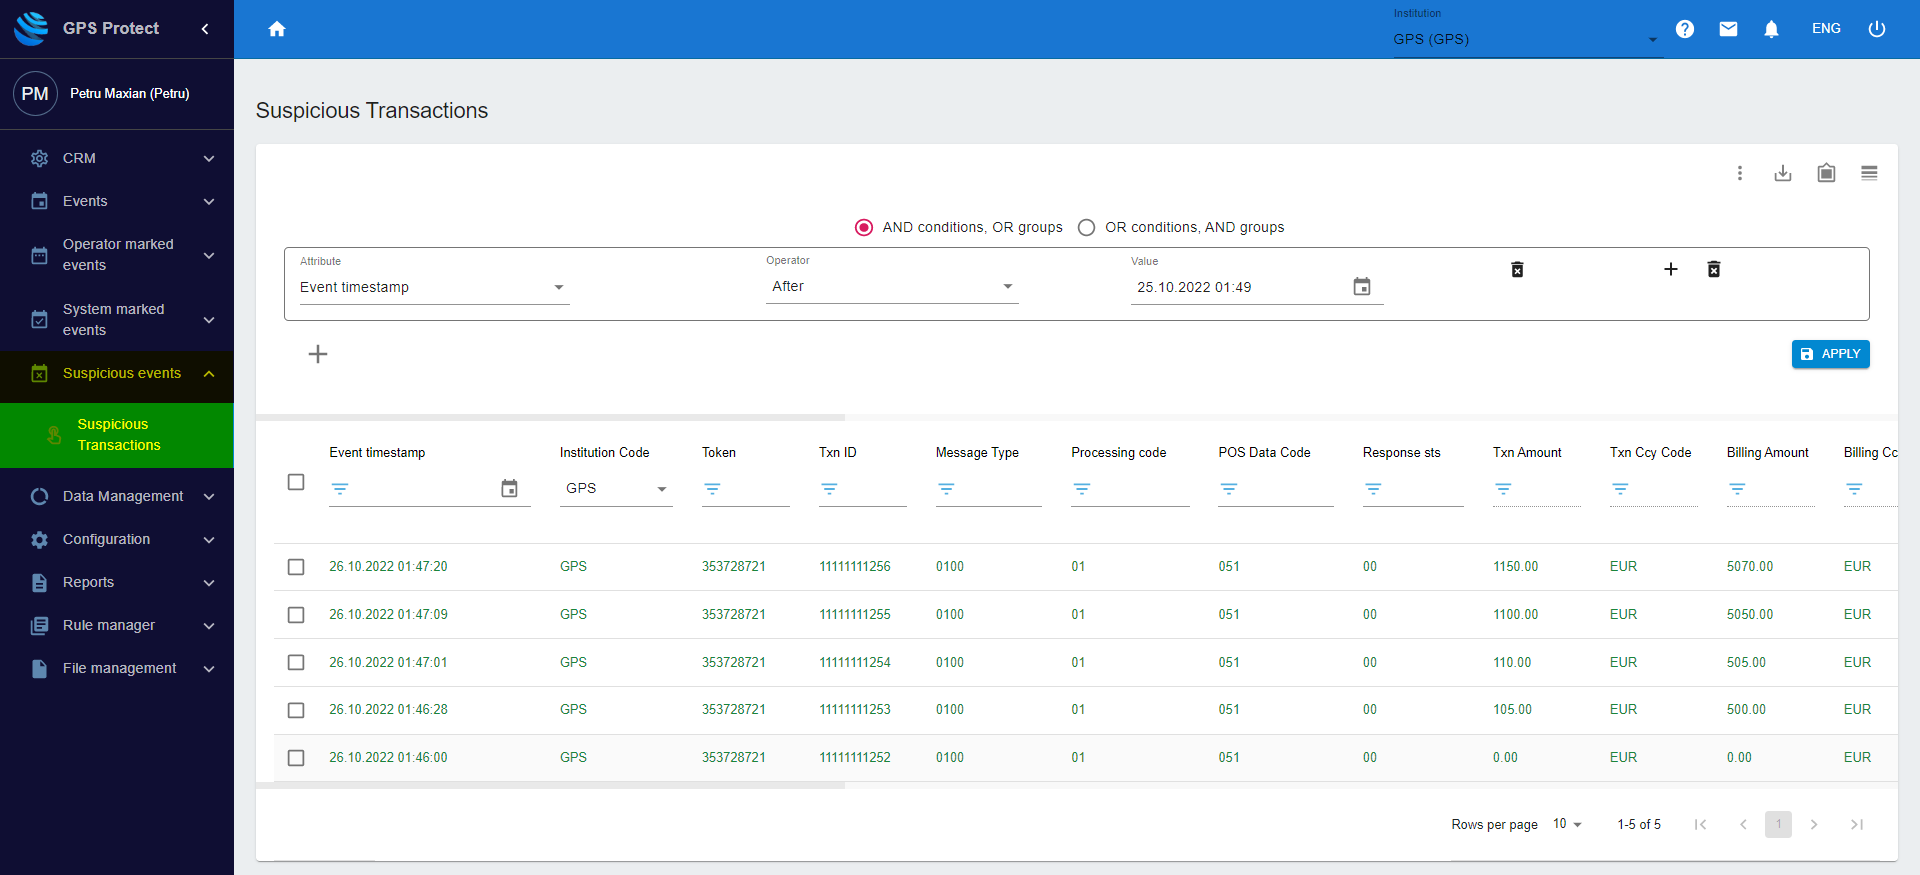
Figure 16: Suspicious events/Suspicious Transactions screen
Because this screen displays all the alerts automatically triggered by the system, Thredd Protect users responsible for investigating these alerts will likely spend most of their time using this screen.
Once the investigation of a particular alert is complete, you can mark the alert with a predefined status, as described below.
5.5.4 Viewing operator-marked events/transactions
The Operator marked events/Transactions screen displays all the transactions that are manually marked and commented on by a user.
Assigning a status to an alert
You can mark a transaction with one of the following statuses:
-
Genuine
-
Investigation
-
Fraud
-
Ignore
To mark a transaction, right-click on the transaction and assign the appropriate status:
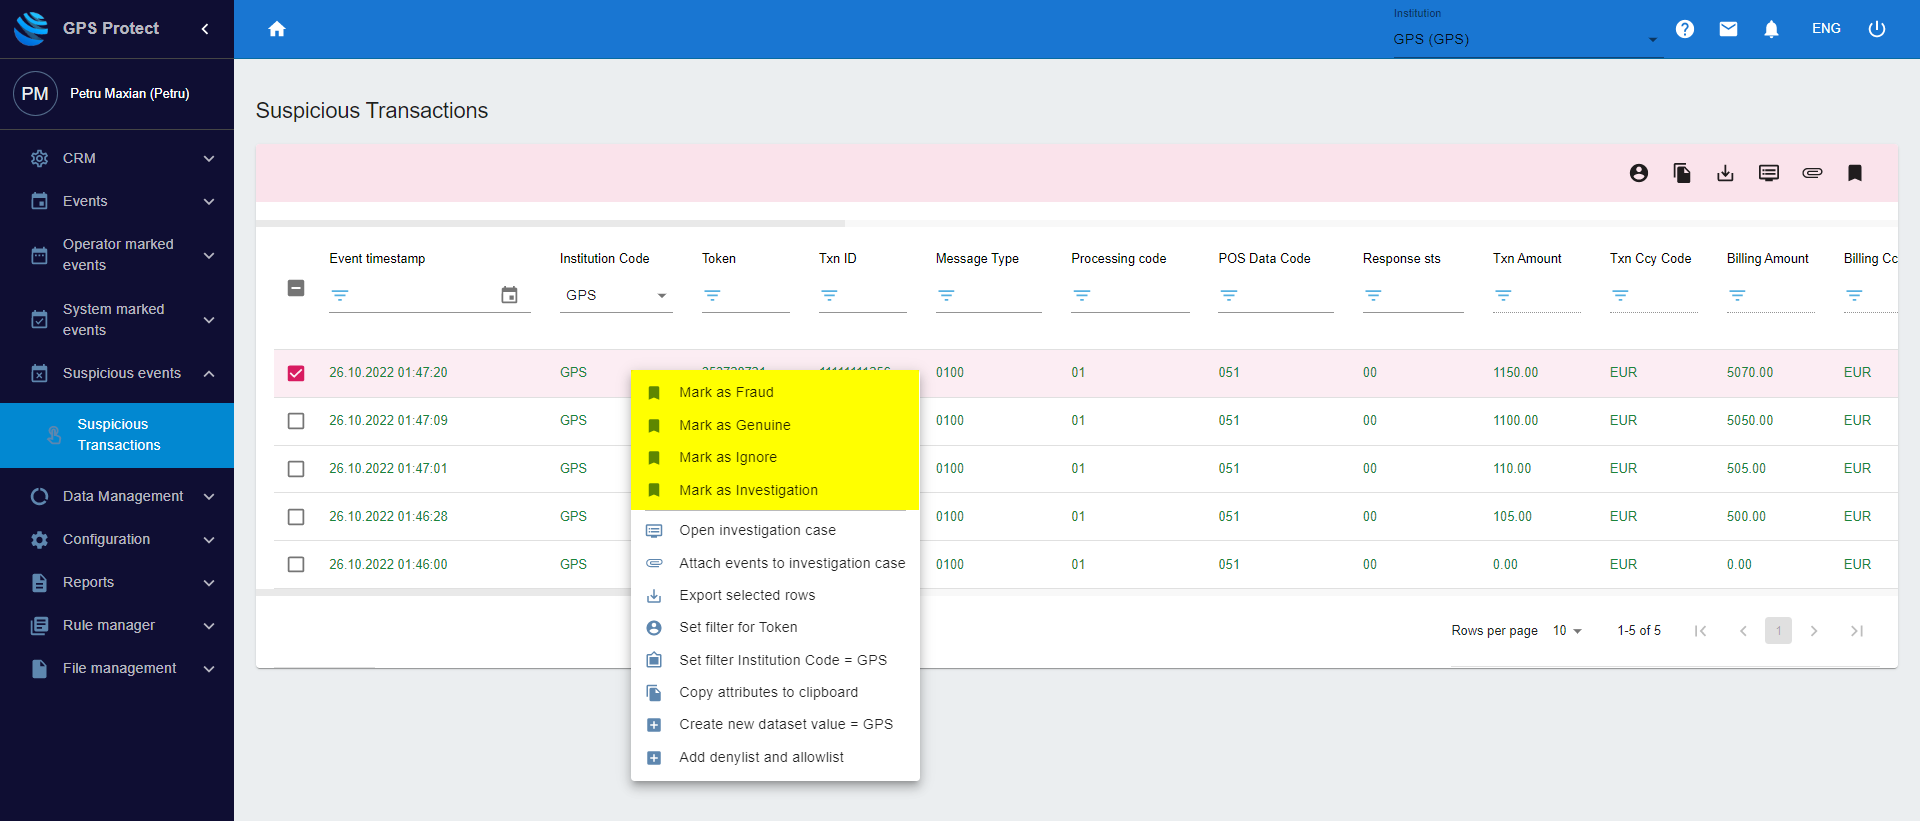
Figure 17: Assigning a status to an alert
By default, new and unmarked transactions are displayed by the system in Green. When a transaction is marked, or its default status is changed, the colour of the event/transaction changes, depending on the newly assigned status.
Transaction colour coding
|
Status |
Colour |
|---|---|
|
Default, new and unmarked by users |
Green |
|
Genuine |
Black |
|
Investigation |
Orange |
|
Fraud |
Red |
|
Ignore |
Grey |
When the status changes, the event/transaction is moved from the Suspicious events > Suspicious Transactions screen, to the appropriate sub-page of the same name as the newly assigned status (under Operator marked events).
![]()
Figure 18: Transactions assigned a status
When you assign a new status to an event/transaction, the alert counter displayed in the top-right corner of the screen also decreases, respectively. This is useful in showing how many alerts remain to be worked.
![]()
Figure 19: Alert counter